Line Graph Pictures, Images and Stock Photos
Browse 17,100+ line graph stock photos and images available, or search for line graph background or bar graph to find more great stock photos and pictures.
line graph background
bar graph
line graph abstract
graph
chart
line graph vector
line graph icon
line graph infographic
line graph up
3d line graph
line graph going up
line graph going down
two line graph
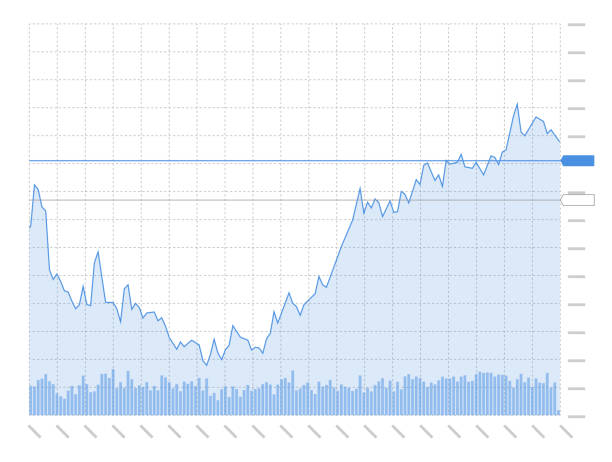
stock market line graph
line graph increase
line graph down
downward line graph
rising line graph
line graph chart
isometric line graph
curved line graph
flat line graph
line graph upward
increasing line graph
upward line graph
trend line graph
thin line graph
simple line graph
data line graph
line graph computer
Most popular
Line graph of rise. Vector illustration.
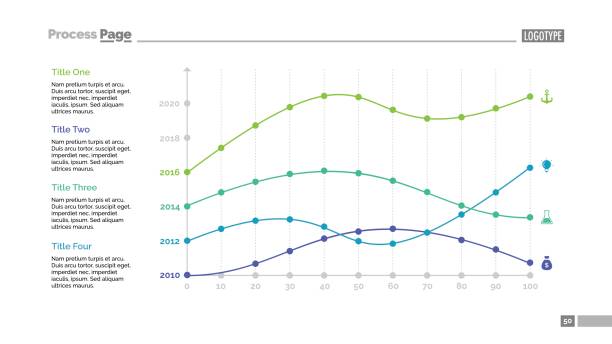
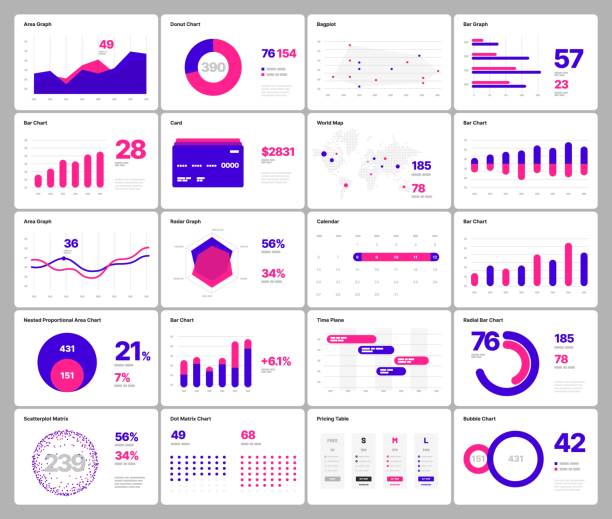
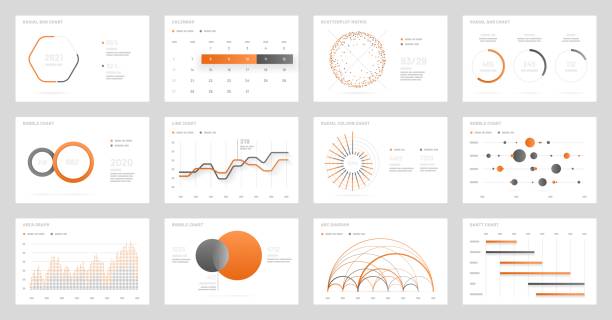
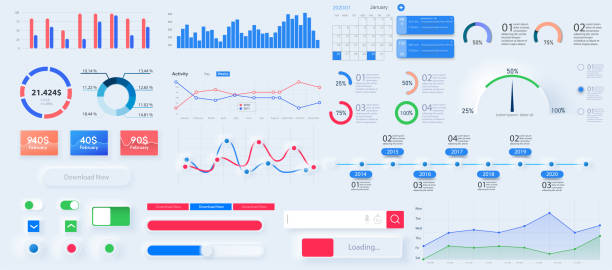
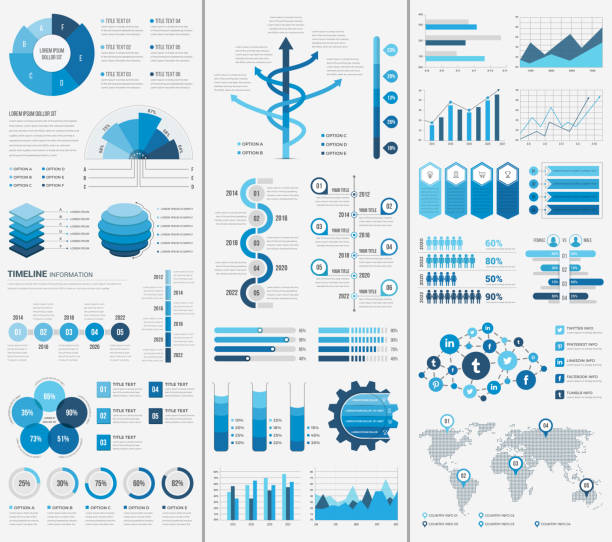
Four line charts slide template. Business data. Graph, diagram. Creative concept for infographic, report. Can be used for topics like statistics, analysis, research.

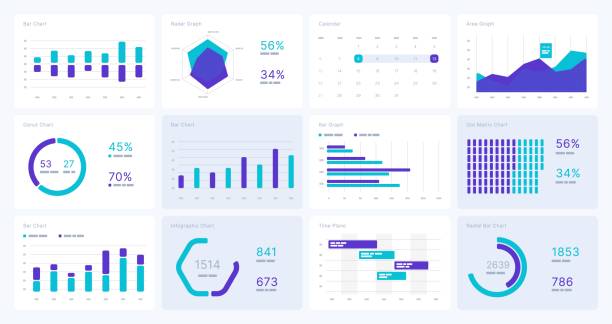
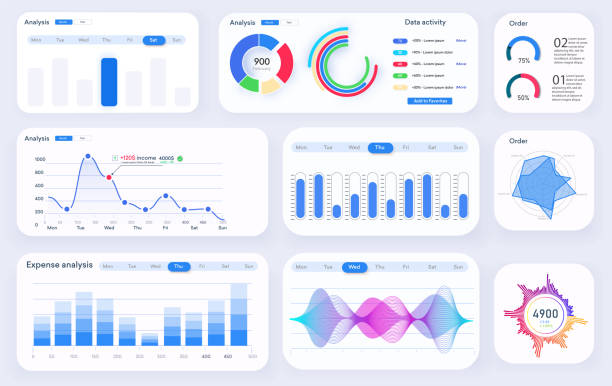
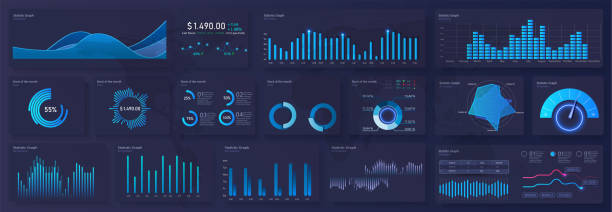
Bundle infographic UI, UX, KIT elements. Modern infographic dashboard, financial statistics and analytics progress scale panel,control diagram, digital display screen.
Modern infographic template with statistics finance charts. Infographics dashboard. Admin panel interface with color charts, graphs on white background. Illustration flowchart and diagram and workflow
Infographic elements for business layout, presentation template, flyer, leaflet and corporate report. UI and UX Kit with big data visualization.

Bar graph and line graph templates, business infographics, vector eps10 illustration
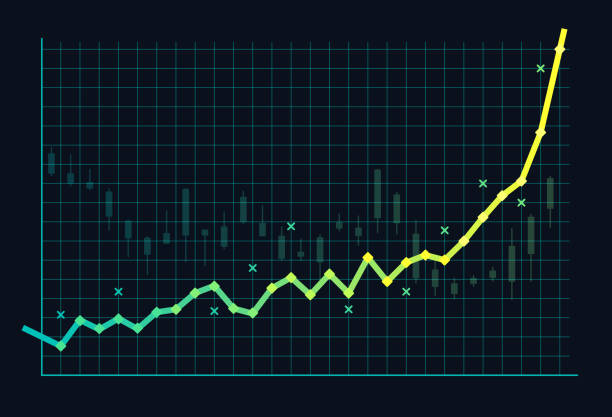
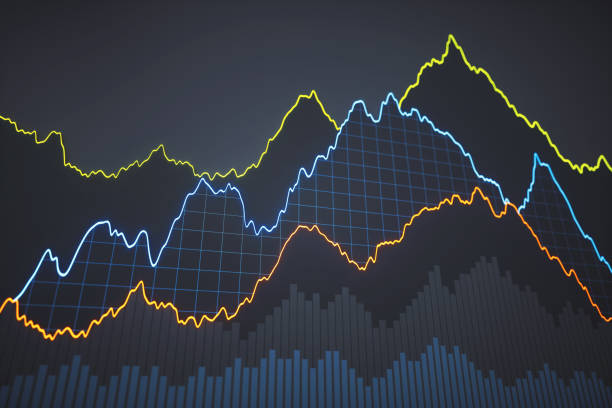
Stock market growth bubble spike exponential growth background concept.
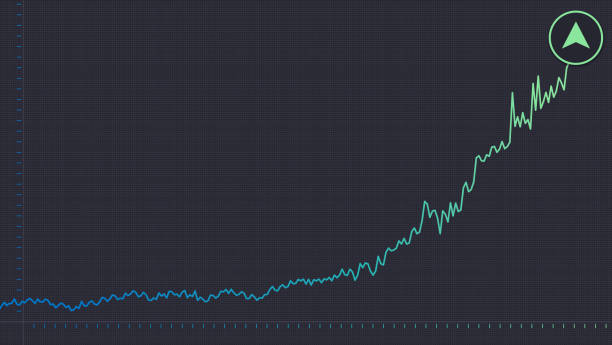
Increasing value cryptocurrency stock commodity price value chart increase with space for your copy.
Vector line icon set appropriate for web and print applications. Designed in 48 x 48 pixel square with 2px editable stroke. Pixel perfect.

Stock market financial data tracking stock chart.

Four line charts slide template. Business data. Graph, diagram. Creative concept for infographic, report. Can be used for topics like statistics, analysis, research.
Red arrow symbol forming a line graph over a graph paper background. Horizontal composition with copy space.
Big set of infographic tools. Use in presentation templates, mobile app and corporate report. Dashboard UI with big data visualization.
Modern background design with abstract graphs and textures. Fully editable vector.
Papers with different graphs and charts, vector eps10 illustration
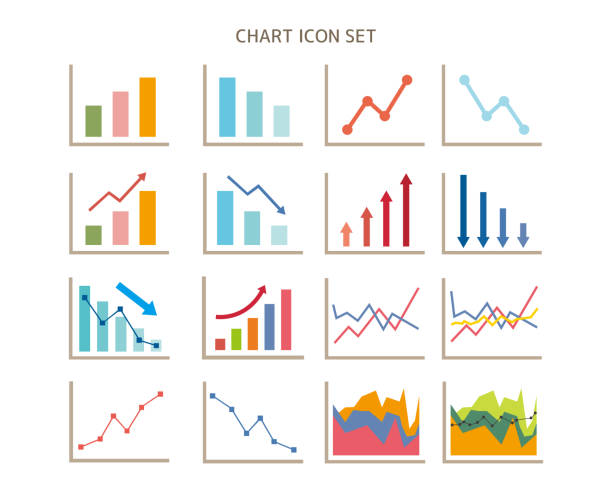
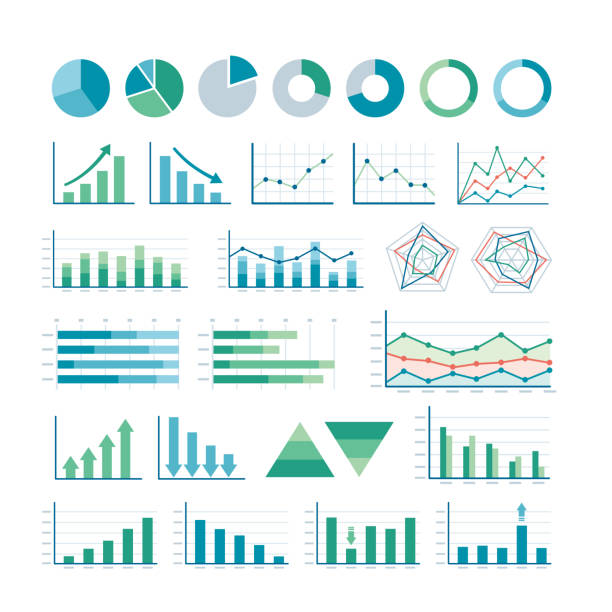
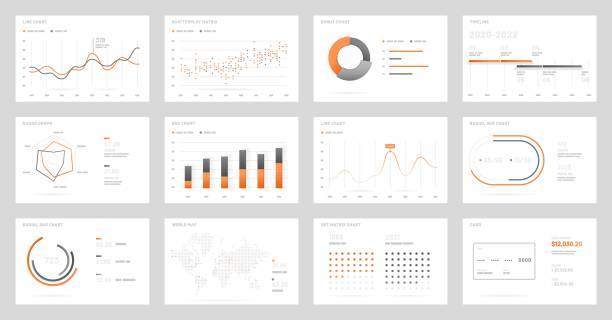
Information Graphics and charts, vector illustration. Bar Graph, Line Graph, Chart, Data, Web Page
Statistics - line icon set. Collection of 20 graphs, charts, diagrams...

Stock market investment trading technical analysis candlestick chart on white background. Business candle stick graph exchange trend. Trader financial investment index concept vector eps illustration
Stock market commodity financial valuation ticker chart average stock price information abstract background.


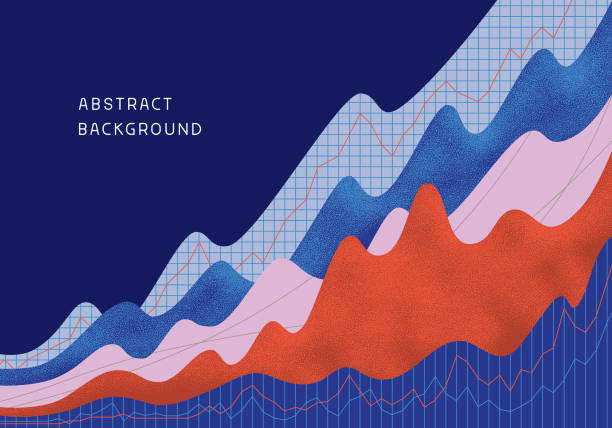
Abstract financial background with uptrend line, textured graphs, charts and copy space. Editable vectors on layers.
Stock market trading exchange chart.
Modern background design with abstract graphs and textures. Fully editable vector.

30 Chart and Diagram Outline Icons.
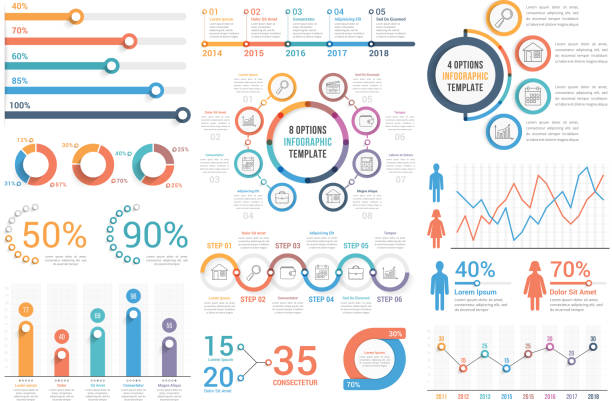
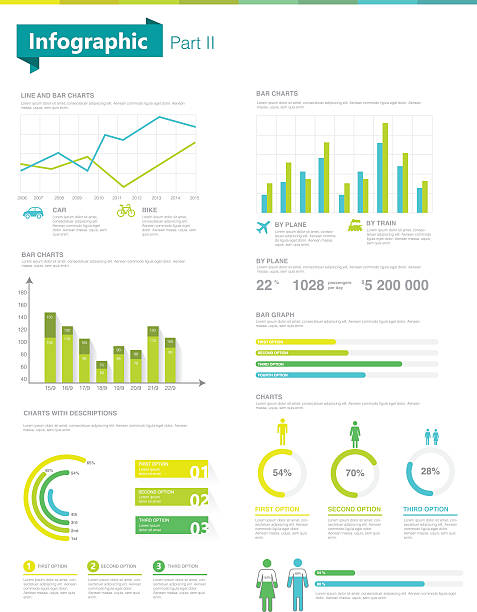
Infographic elements - bar and line charts, percents, pie charts, steps, options, timeline, people infographics, vector eps10 illustration
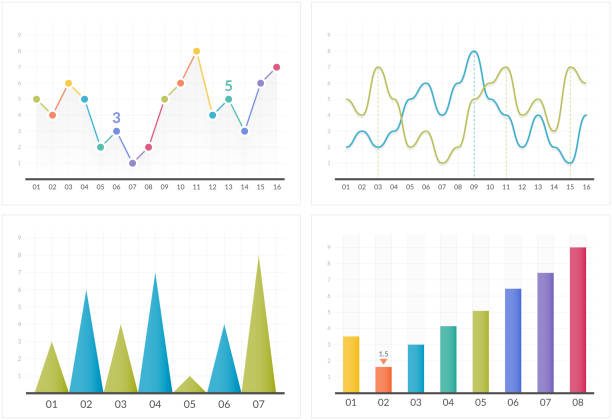
Bar and line charts, business infographics, vector eps10 illustration
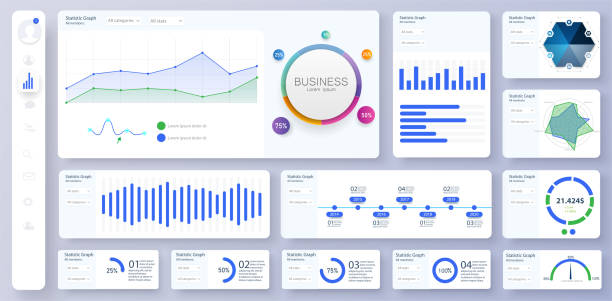
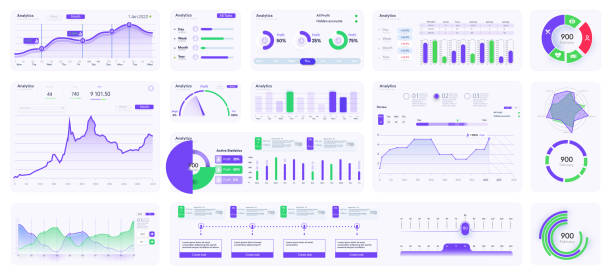
Informative and simple dashboard. Colorful infographics template for business and other projects. Admin panel interface with color charts, graphs, 3D infographics.
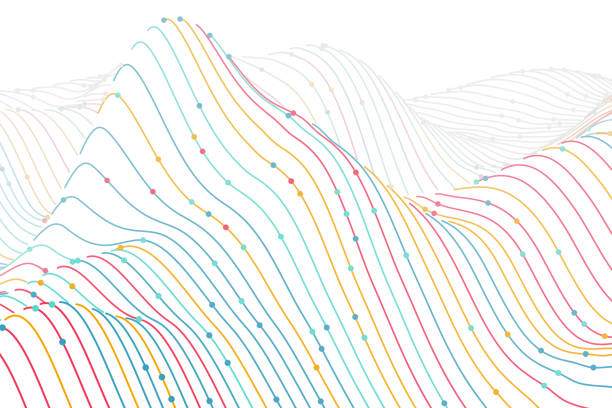
3D digital colored wireframe landscape on white background. Sound waves abstract visualization. Concept of big data charts analysis and information technology. Vector illustration of sound waves flow.

A three dimensional graph formed from metal sticks and shiny metal multi-coloured spheres, resting and casting a shadow on a pastel multi-coloured background.

Economy, growth, chart, graph, rise, rising, up, exchange, financial, bar vector.
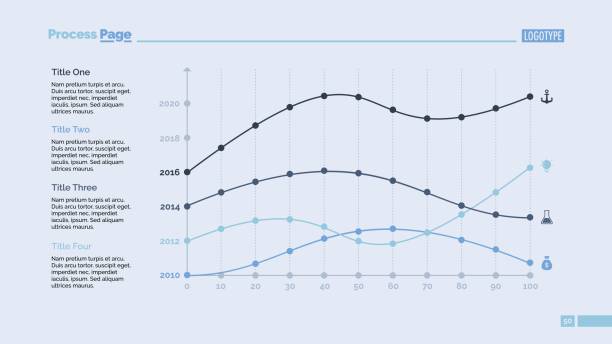
Four line charts slide template. Business data. Graph, diagram. Creative concept for infographic, report. Can be used for topics like statistics, analysis, research.

Infographic elements. Use in presentation template, flyer, leaflet and corporate report. UI and UX Kit with big data visualization.
Chart financial asset movement abstract lines background design with space for your copy.

Web dashboard, great design for any site purposes. Business infographic template. Vector flat illustration. Dashboard user admin panel template design.
Infographic dashboard template with flat design graphs and pie charts. Information Graphics elements for web design. Web elements in moden style.

Stock market candlestick financial growth chart.
Graph, Line Graph, Chart, Data, Stock Market
NOTE FOR REVIEWERS: This image is a 3D render and does NOT have a corresponding vector file


Trading charts and data background on pixelated screen

Admin dashboard charts. Infographic web page, data graphic UI,UX, KIT screen cards and statistic chart diagrams.
vector illustration of Graph icons,eps 10
Big set of infographic tools. Use in presentation templates, mobile app and corporate report. Dashboard UI with big data visualization.

close-up view of financial graphs, bar, circle and line charts (3d render)

This infographic set is designed to help you to produce presentations, re-use graphics for compare different products, for your graphic inspirations and many more.
This is Infographic Elements. It can be used in almost every project.
Modern modern infographic vector template with statistics graphs and finance charts. Diagram template and chart graph, graphic information visualization